Revamped dashboards and reporting features enable secure and actionable client insights
Questica Software Inc. (“Questica”), has released revamped dashboard and reporting features for its Questica Budget suite. The new feature updates allow clients to spend less time compiling numbers and generating reports. Instead, clients can efficiently explore and analyze their budget and other data for actionable insights that can help drive priorities and positive outcomes for those they serve.
Today’s public sector organizations are under intense pressure to deliver programs and services in a fiscally responsibly manner,” said Stephen Rohleder, CEO of GTY Technology. “Questica’s commitment to ongoing product innovation is one of the ways they deliver an exceptional customer experience. Questica consistently tailors their solutions to meet client requirements by listening to our clients’ strategic priorities, then working with them to build those features.

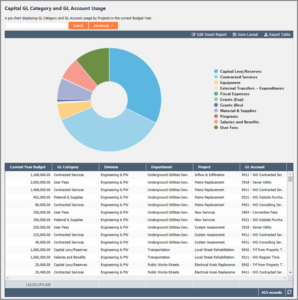
A Questica Budget Smart Report Example
Questica Budget’s latest software release (2019.3) enhances the already robust analytics and reporting functionality within the system, allowing users to:
- Create, personalize and share intuitive dashboards and onscreen reporting with an easy-to-use drag and drop interface
- Drill-down and drill-through dashboards and Smart reports
- Turn on/off the table and data visualization chart options for Smart onscreen reporting
- Access the Report Center’s ready-built, editable templates and add in any additional data desired such as other calculated columns and table features
- Create reports that have a clean modern look with standard headers, footers, and logo embed options
- Secure and share the data on dashboards and reports, so users only see what they need to see.
Data is an important and strategic asset that informs decisions about the programs and services that can be provided, so we want to change how our clients see their budget and financial data,” states James Orr, Product Manager at Questica. “Our contextual dashboards with their interactive charts and widgets can provide organizations better collaboration and decision-making abilities, whether it is accessing cost center and project specific details, comparing the budget to actuals, or assessing performance trends over time.;

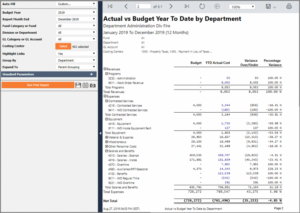
A Questica Budget Print Report Example
Questica Budget is an end-to-end, cloud-based multi-user operating, capital and salary budgeting, performance measures and reporting solution. Government, education and healthcare clients use the system for multi-year planning, forecasting and analysis, budget workflow and audit trail, role-based security access, and amendment tracking. In addition, public sector organizations can conduct workforce planning, funding gap and revenue analysis, and capital improvement planning, along with revenue and activity-based modelling and unlimited what-if scenarios. As well, clients use Questica OpenBook, our integrated budget transparency and data visualization tool to share financial and other data such as interactive maps, charts, tables and graphs to promote and support deeper staff and stakeholder consultation and engagement.
For more information about how Questica Budget Suite can help transform your organization’s budgeting and reporting process, please register for one of our free monthly webinars or schedule a personal demonstration with one of our budget professionals.